PolyWorks|DataLoop™ Tutorials
Learn how to access and review 3D inspection data, and monitor and analyze 3D measurement results in real-time.
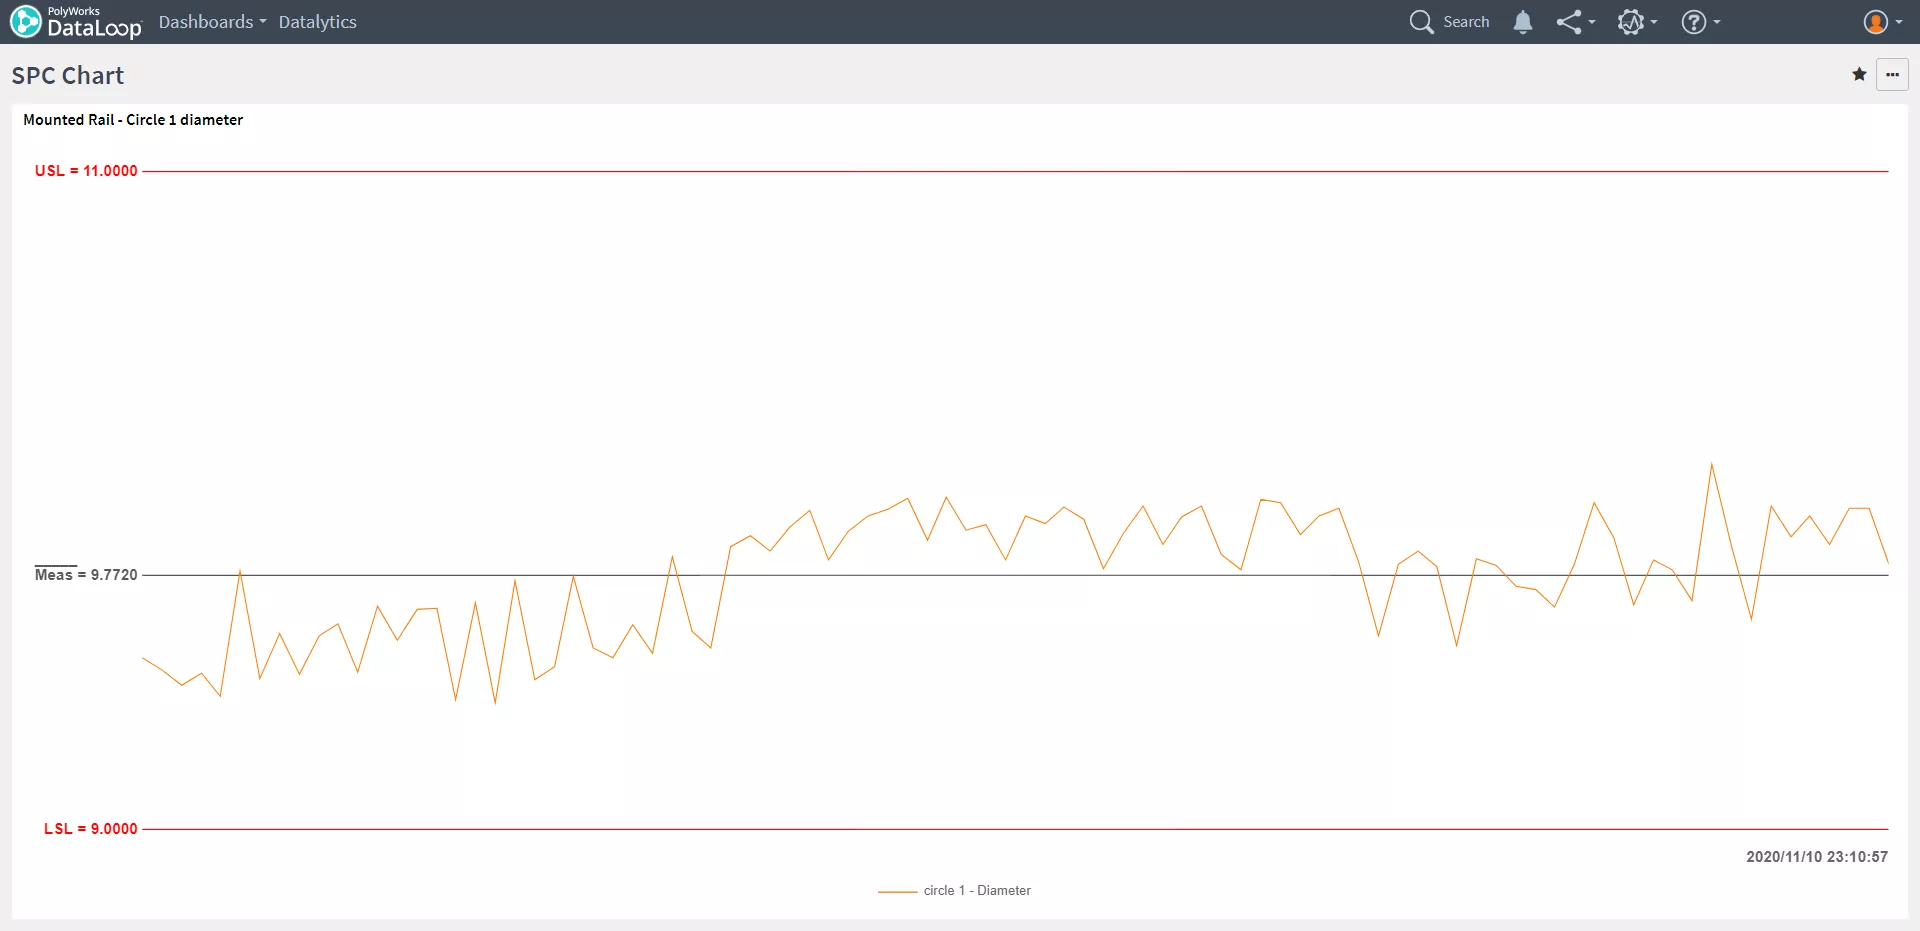
The SPC Chart
- Illustrate the variation of specific control values over multiple pieces with SPC charts
- Set rules that will color the widget as a warning when abnormal variations are detected
