PolyWorks|DataLoop™ Tutorials
Learn how to access and review 3D inspection data, and monitor and analyze 3D measurement results in real-time.
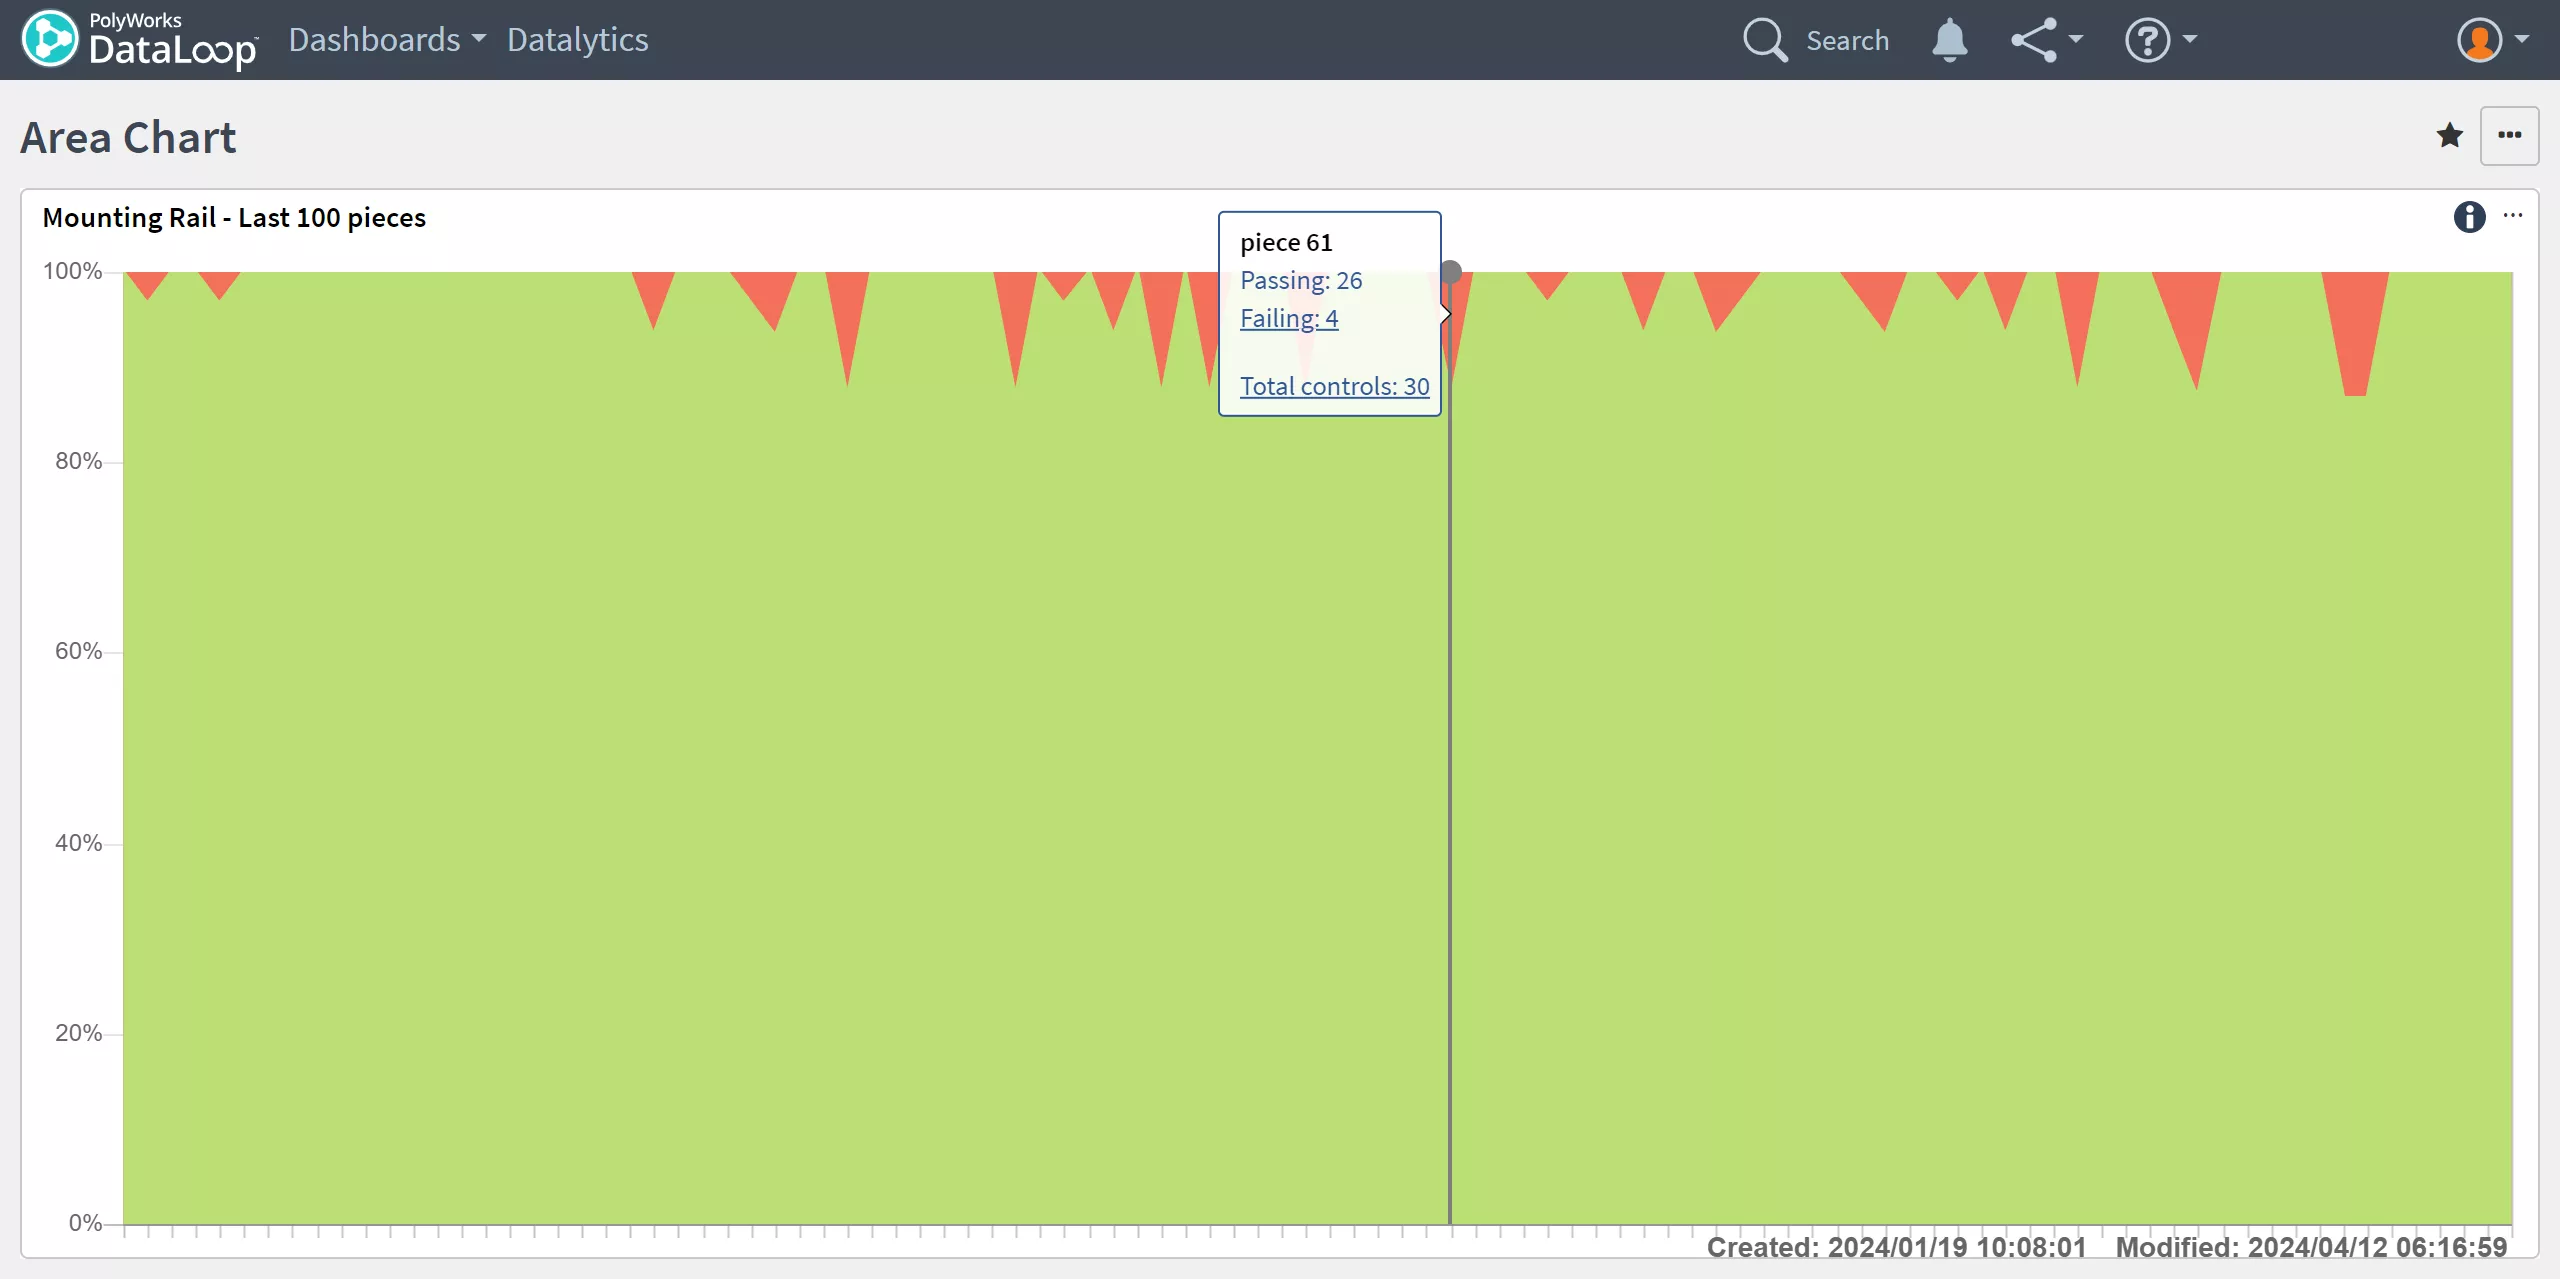
The Area Chart
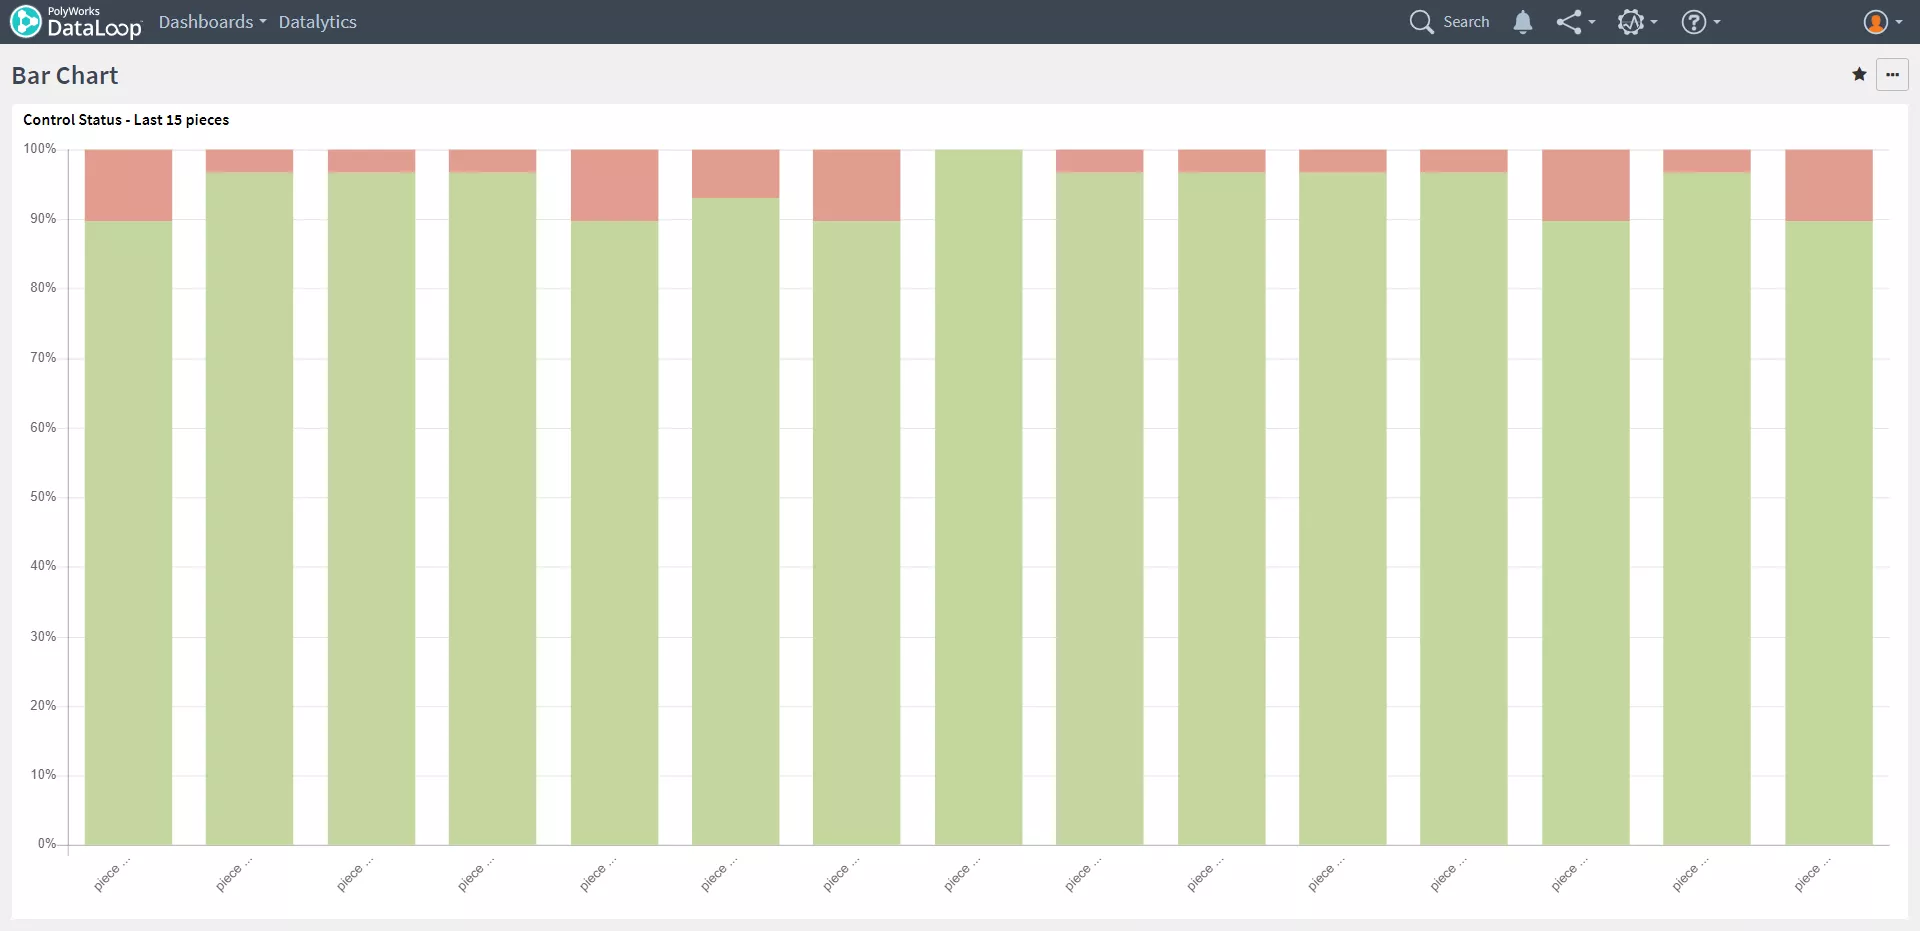
- Illustrate how parts of a whole change over time using Area charts
- See the percentage of controls that pass and fail on consecutive pieces
